Diagnostic
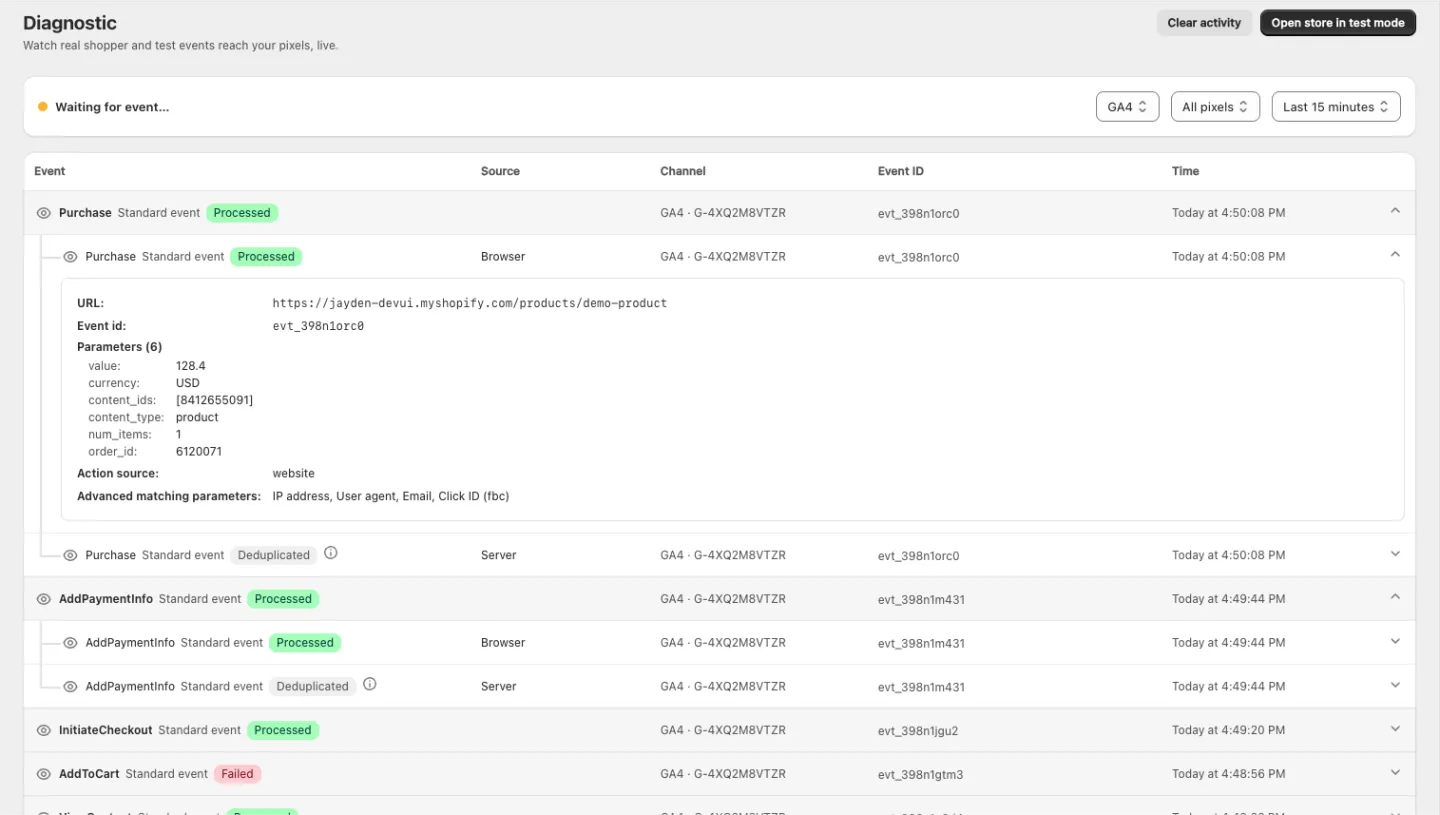
Diagnostic lets you watch real shopper and test events reach your pixels, live. It's how you confirm a pixel works before you spend money on ads through it — and how you check whether the browser hit and the server hit are both landing.
Before you start
Diagnostic needs a test event code (Meta) or Debug mode (GA4) on the pixel you want to watch — that's what routes your test traffic to Meta Test Events or GA4 DebugView.
Without one you'll see a warning: "Add a test event code to run diagnostic", with an Add test event code button that takes you to Connections.
With no pixels at all, the feed shows "No pixels yet" — "Add a Meta or GA4 pixel first, then come back here to watch its events live."
Choosing what to watch
A bar at the top shows whether traffic is arriving:
- 🟢 Live - events streaming in
- 🟡 Waiting for event…
Next to it, three dropdowns: Platform, Pixel (or all pixels on that platform), and the time window — Last 5 minutes, Last 10 minutes, or Last 15 minutes. Events older than the window drop off the feed.
The feed refreshes itself roughly every 10 seconds.
Generating traffic
- Open store in test mode (top right) opens your storefront through a test link, so the events you generate are tagged as test traffic.
- Or just browse your storefront normally, or complete a test checkout — real events show up here too.
- Clear activity empties the feed when you want a clean run.
While you're waiting, the feed reads "Waiting for events" — "No events in the last 15 minutes. Browse your storefront (or complete a test checkout) and events for this pixel will appear within a few seconds."
Reading the feed
Each row is one event:
| Column | Description |
|---|---|
| Event | The event name — e.g. Purchase, AddToCart — labelled Standard event or Custom event, matching how Events Manager classifies it |
| Source | Browser or Server |
| Channel | The destination — platform plus pixel ID |
| Event ID | The shared ID that ties the browser hit and the server hit together |
| Time | When it arrived |
If several pixels are connected, the same shopper action appears once per destination pixel — each pixel gets its own browser hit and its own server hit.
Browser receipt and server receipt
Expand an event and it splits into two receipts. This pairing is the point of the page:
| Status | Meaning |
|---|---|
| Processed | Accepted and counted |
| Deduplicated | "Also received from the browser with the same event ID, so it was counted once (deduplicated). Correct - no data lost." |
| Failed | The platform rejected it |
Deduplicated on the server row is the healthy result, not an error. It means the browser hit arrived first and the server hit correctly matched it, so you get one conversion instead of two. The tooltip next to the badge says as much.
A Failed receipt gets a Fix in Connections link right underneath it.
Event details
Expand a receipt to see the payload the platform received:
- URL — the page the event fired from
- Event id
- Parameters (with a count in the heading) — whichever apply to that event:
value,currency,content_ids,content_type,num_items,order_id. Events with none say "No parameters for this event." - Action source — always
website - Advanced matching parameters — which hashed customer fields were sent, if Advanced matching is on
Use this to check a conversion is carrying the right value and currency before you trust the numbers in your ad platform.
What Diagnostic can and can't tell you
It shows what the app sent and what each platform's response was. It doesn't replace Meta Events Manager or GA4 DebugView — pair it with them: Diagnostic proves the event left your store correctly, the platform's own tool proves what it did with it afterwards.
For the volume question — "am I capturing all my orders?" — use Reconciliation instead.
Next steps
- Reconciliation — captured vs real Shopify orders
- Alerts — get told when tracking breaks instead of checking manually