Analytics Page
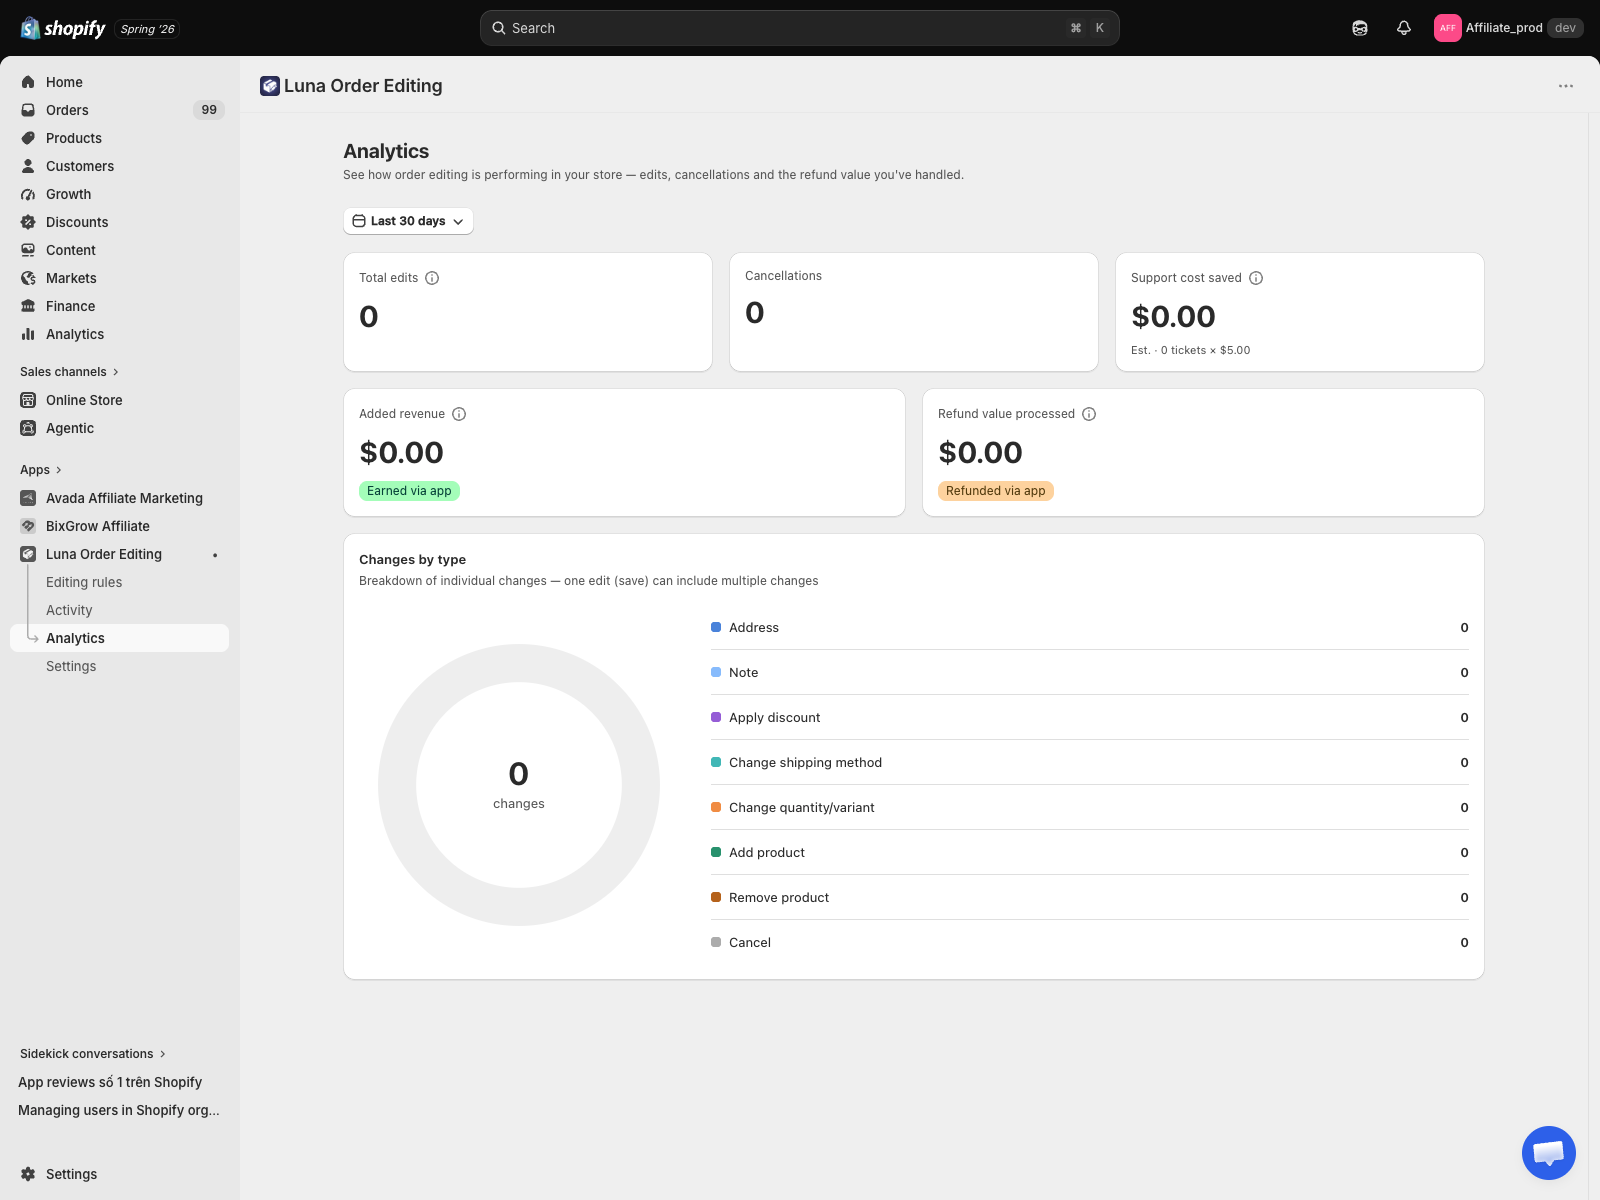
The Analytics page turns every customer edit into a story you can act on: how much work the app handled for you, how much support cost you saved, how much extra revenue customers added, and how much refund value you processed. It reads in about ten seconds.
Why this matters
Without this page you only see two numbers on the Dashboard — total edits and cancellations. You cannot see the money story: whether customers are adding to their orders, how much refund work the app is doing for you, or how much support time you are saving. Analytics makes the return on the app visible so you can decide it is worth keeping.
What it does
- Reads the customer edits already recorded by the app and rolls them up for the date range you pick.
- Shows five KPI cards at the top: Total edits, Cancellations, Support cost saved, Added revenue, and Refund value processed.
- Shows a Changes by type donut that breaks every change down into eight categories.
- Everything on the page refreshes together when you change the date range.
The page never shows customer names or emails. It only shows counts and totals.
Before you start
- The app must be installed and enabled. Analytics has no separate setup — it fills in automatically as customers edit orders.
- You need at least one customer edit for the numbers to move. A brand-new store will see the full layout with every value at 0 (this is normal, not an error).
Setup
There is nothing to configure to open Analytics. Click Analytics in the left sidebar, below Activity.
Step 1 — Pick a date range
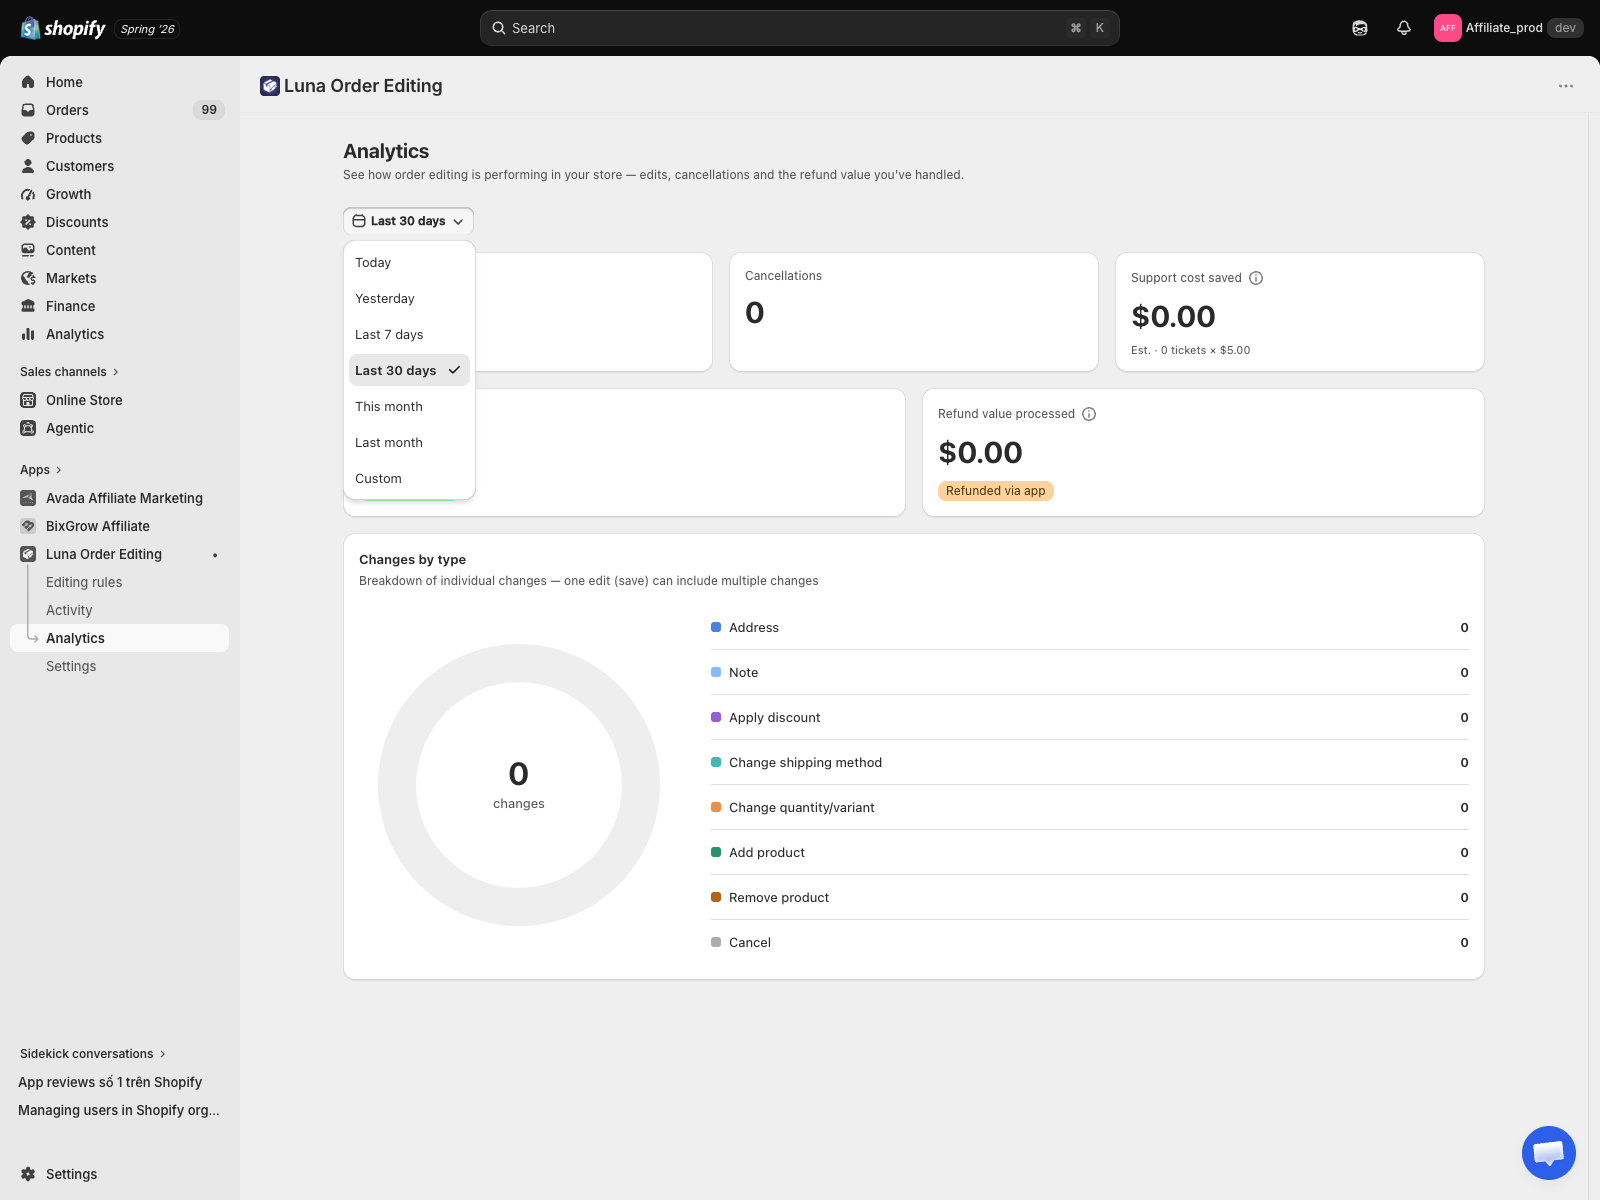
The date range filter sits under the page description, above the cards. Click it to open a picker with presets (Today, Yesterday, Last 7 days, Last 30 days, This month, Last month) and a custom range you set on the calendar. The default is Last 30 days.
Support cost saved is estimated as number of edits × $5 per ticket. The $5 figure is fixed in this version and is not merchant-adjustable.
Verify
Open Analytics and check that Total edits matches the Total Edits number on your Dashboard for the same date range. They count the same thing (see below), so they should always agree. If the page is still loading you will see skeleton placeholders instead of zeros — wait a moment for the numbers to settle.
How it works
The five KPI cards
| Card | What it counts |
|---|---|
| Total edits | The number of times a customer saved an edit — one save = one edit. Matches your Dashboard. |
| Cancellations | Orders your customers cancelled themselves. |
| Support cost saved | Estimated savings from self-service edits: each edit is treated as one support ticket avoided (edits × a fixed $5 per ticket). Marked Est. because it is an estimate. |
| Added revenue | Money customers paid on top of the original order through their edits — adding a product, increasing quantity, or upgrading to a pricier variant. |
| Refund value processed | Money refunded to customers through edits and cancellations the app handled for you. |
Total edits vs Changes — the key difference
This is the one thing worth understanding so the numbers never look wrong:
- Total edits counts saves. When a customer opens their order, makes some changes and hits save, that is one edit — no matter how many things they touched.
- Changes counts individual actions. In that same save, a customer might update the address and add a note and change a quantity — that is three changes.
Because one save can hold several changes, the total number of changes is always greater than or equal to Total edits. They are two different units, so do not expect them to match. The microcopy on the page says it plainly: one edit (save) can include multiple changes.
Changes by type
The donut breaks every change into eight categories, with the total number of changes in the centre:
| Category | Meaning |
|---|---|
| Address | Shipping address updated. |
| Note | Order note added or changed. |
| Apply discount | A discount applied to the order. |
| Change shipping method | Shipping method switched to a different rate. |
| Change qty/variant | Quantity changed, or a line swapped to a different variant. |
| Add product | A new product added to the order. |
| Remove product | A product removed from the order. |
| Cancel | The order cancelled. |
Each legend row shows the category name, its count, and its share as a percentage in brackets. Hover a slice and the centre of the donut switches to show that slice's percentage and name. All slices always add up to 100%, and a category with no activity still appears with a value of 0 (a category simply reads 0 until a customer makes that kind of change).
Cancellation retention
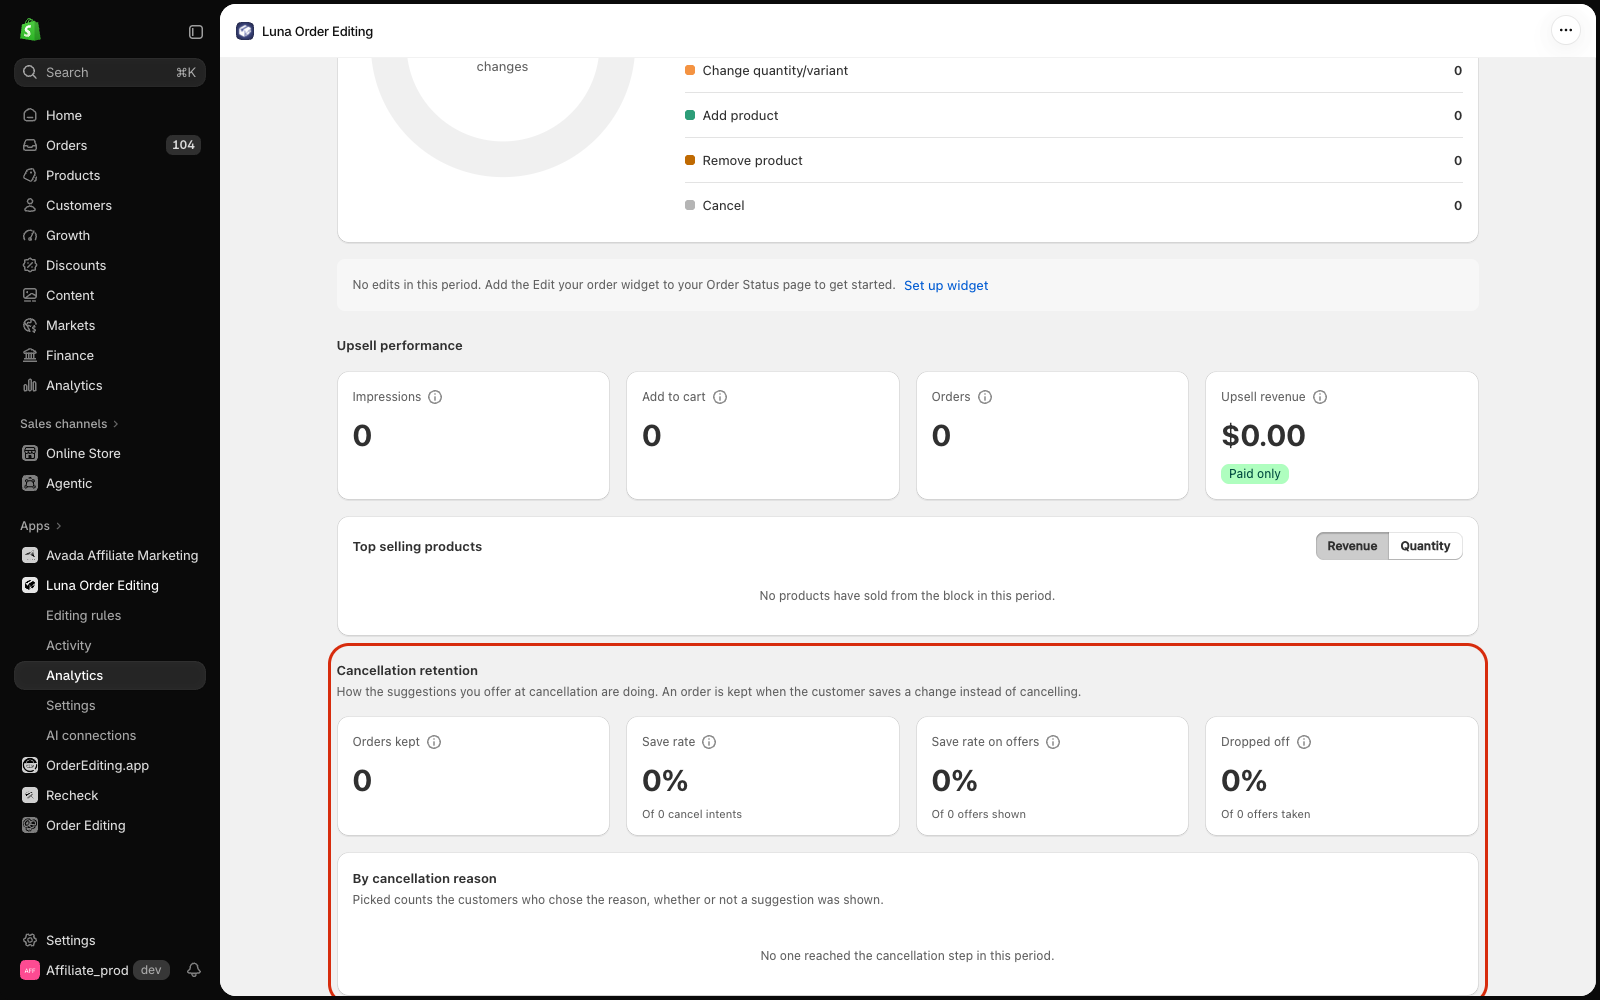
At the bottom of the page, Cancellation retention shows how the offers you set in Offers to keep the order are doing. An order counts as kept when the customer saves a change instead of cancelling. It follows the same date range as the rest of the page.
| Card | What it counts |
|---|---|
| Orders kept | Orders where the customer took a suggestion and saved a change instead of cancelling. |
| Save rate | Orders kept, out of every customer who opened Cancel this order. |
| Save rate on offers | Orders kept, out of the customers who were actually shown a suggestion. |
| Dropped off | The share of customers who accepted a suggestion but left without saving. |
The By cancellation reason table lists each reason with its suggestion and the columns Picked, Shown, Kept and Save rate. Picked counts every customer who chose that reason, whether or not a suggestion was shown. All rates are rounded to whole percentages and never go above 100%. If nobody reached the cancellation step in the range, the section reads No one reached the cancellation step in this period.
Known limitations
Read these before drawing conclusions from the numbers.
- Support cost saved is an estimate, not billed savings. It assumes every edit replaced one support ticket at a fixed $5 each.
- Refund value processed counts only refunds the app handled. Refunds you issue manually in Shopify, or through another app, are not included here — so this figure can be lower than your total refunds.
- Multi-currency stores: if your orders use several currencies, the money totals are summed as if they were all in your store's main currency, which can introduce a small rounding difference.
- No export yet. CSV/PDF export and scheduled email reports are not available in this version.
Troubleshooting
| What you see | Likely cause | What to do |
|---|---|---|
| Every number is 0 | No customer edits in the selected range yet | Widen the date range, or place a test edit. A live store with real edits will fill in automatically. |
| Total edits ≠ Dashboard edits | Different date range on each page | Set both pages to the same range — they count the same way and should match. |
| Changes total is higher than Total edits | Expected behaviour | One save can contain several changes; see Total edits vs Changes. |
| Added revenue stays at 0 | No customers added products or upgraded to pricier variants in this range | Expected if no upsizing edits happened; it fills in when they do. |
| An error message with a Retry button | The page could not load the data | Click Retry. If it keeps failing, contact support. |
Data & privacy
- Analytics only shows aggregated counts and totals — it never displays a customer's name or email.
- Every number is scoped to your store only; you never see another store's data.
- Money totals are shown in your store's main currency, formatted for that currency automatically.
Next step
- See individual edits with full before/after detail on the Activity page.
- Configure customer actions in Editing rules and emails in Email notifications.